The Nordic Region in maps
An interactive atlas of the Nordic Region — a closer look at the territories, trends and transitions shaping the Nordics.
Nordic data, made visible
Four key topics
Every topic pairs an interactive map with the indicators that matter most — compared across the Nordic countries and their autonomous territories.
Demography
Who lives where, and how is the Nordic population changing? Age and gender balance shape the demands on housing, schools and care.
Labour Market
A look at employment, unemployment and the prospects for younger workers across Nordic countries and autonomous regions.
Economy
How much Nordic households earn, how evenly it's shared, and how regional economies grow and innovate — from municipal incomes to GDP and business R&D.
Environment
Renewable energy, emissions and forest cover — the foundations of the Nordic green transition.
New ways to see the Nordics
Experimental maps
Experimental views, regional deep-dives and charts that explore the Nordics from new angles.
3D map of the Nordic population
Peruse over vast, sparsely settled lands and dense urban clusters across the Nordic Region.
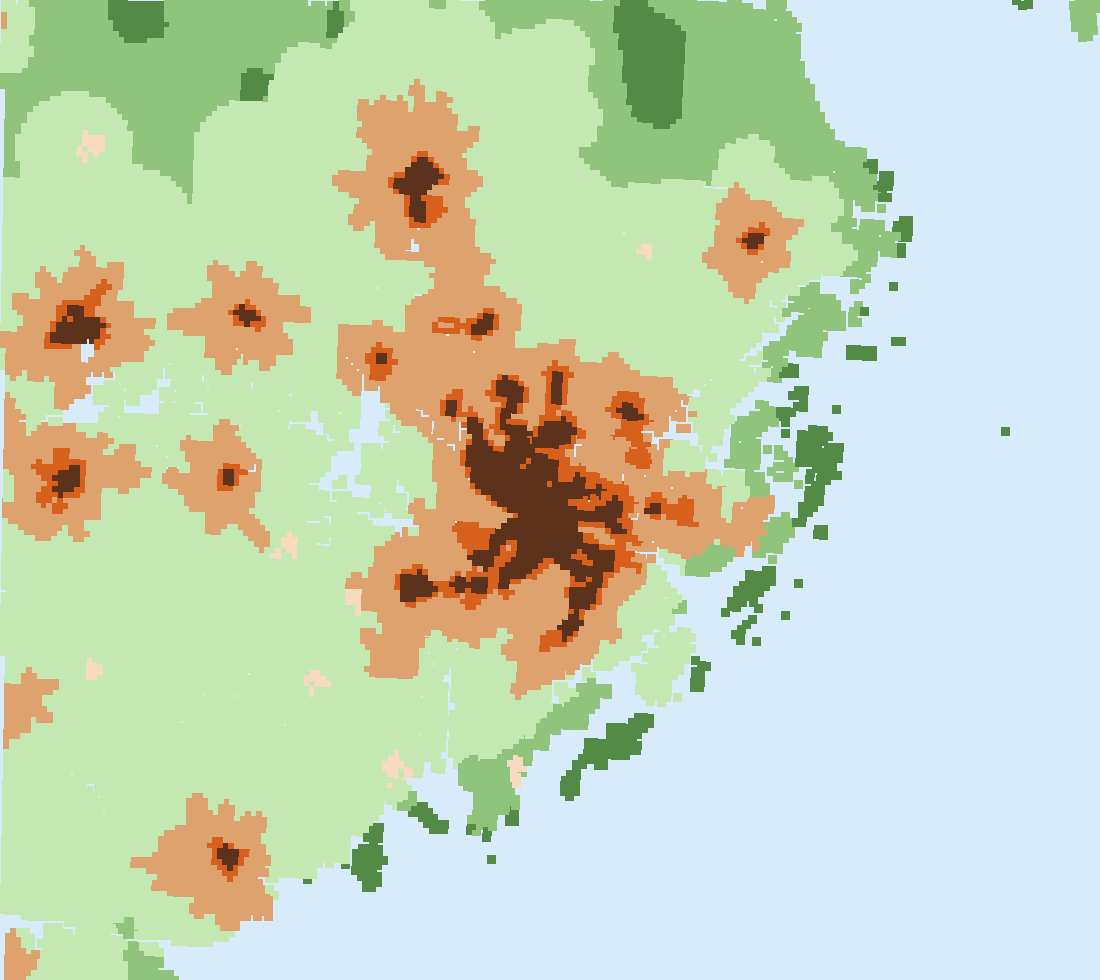
Nordic Urban–Rural Typology
A grid-based classification across the urban–rural continuum — seven classes from dense city cores to sparsely populated rural land.
How much land equals a Nordic capital?
Hover across the region to see how much area it takes to match in population Oslo, Stockholm, Copenhagen, Helsinki or Reykjavík.
How long is the Nordic coast?
Shrink the ruler from 50 km to 100 m and watch the Nordic coastline stretch ever longer — the coastline paradox, mapped across the Nordic countries.